

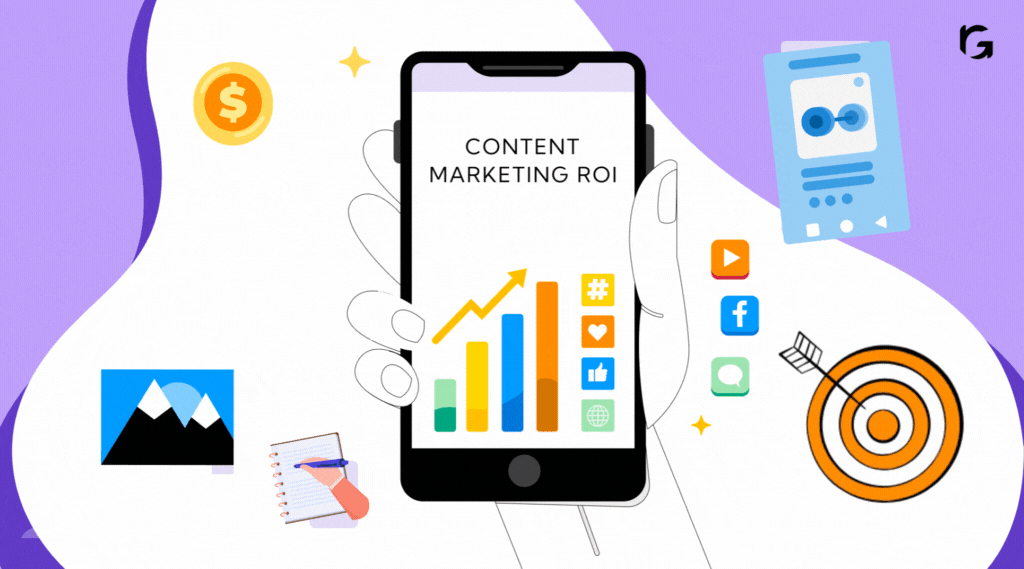
Are you spending time and money on content marketing but not seeing the ROI you hoped for? You're not alone.
According to HubSpot's State of Marketing Report, 82% of marketers use content marketing, yet only 42% can prove its effectiveness. That gap between effort and results is costing businesses millions.
At RevvGrowth, the real power of content lies in its ability to show measurable results. To help you achieve this, we created the Content ROI Dashboard, designed to maximize your content marketing ROI with ease and precision.
In this guide, you'll learn how to calculate ROI properly, avoid common mistakes, and use our free dashboard to track performance in real time.
What is Content Marketing ROI?
Content marketing ROI measures the return on your content investments. It tells you whether your blog posts, videos, webinars, and other content assets are actually driving business results.
The basic formula is simple: ROI = (Revenue from Content - Cost of Content) / Cost of Content × 100
But here's where it gets tricky. Unlike paid ads, where you can track immediate conversions, content marketing often involves long sales cycles, multiple touchpoints, and delayed returns.
Why Traditional ROI Calculations Fall Short
Traditional ROI calculations work great for direct response campaigns. You spend $1,000 on ads, generate $3,000 in sales, and your ROI is 200%. Simple.
Content marketing is different. A blog post you publish today might influence a purchase six months from now. A webinar might assist three different touchpoints in a buyer's journey. An ebook might build brand awareness that pays dividends for years.
According to Content Marketing Institute's research, only 42% of B2B marketers rate their content marketing as successful. The primary reason? They can't prove ROI.
That's why you need a more sophisticated approach that accounts for assisted conversions, long-term value, and multi-touch attribution.
Why Content Marketing ROI Matters
Measuring content marketing ROI isn't just about proving your value. It fundamentally changes how you approach content strategy.
1. See How Your Content is Performing
ROI measurement shows you exactly which content drives results across different channels.
You can track engagement and conversion rates on LinkedIn, email campaigns, webinars, and your blog. When you identify the highest-performing content types and platforms, you can double down on what works.
For example, you might discover that case studies convert 3X better than product comparison posts. Or that video content generates 5X more engagement than text-only posts. This insight is gold.
2. Make Better Decisions
Knowing what works and what doesn't lets you refine your content strategy with confidence.
If a particular blog series or video content isn't resonating with your audience, you can pivot to more impactful formats. According to Demand Metric research, companies that measure content ROI are 2.5X more likely to report success than those that don't.
By leveraging ROI data, you ensure your decisions are data-driven rather than based on gut feelings or assumptions.
3. Use Your Resources Wisely
Measuring ROI ensures every dollar and hour spent on content marketing yields maximum returns.
This means you can allocate more budget to high-performing channels like LinkedIn ads or sponsored content that drive substantial engagement and leads. You can also identify content types that deliver poor returns and either improve or eliminate them.
Efficient resource allocation optimizes your marketing spend and enhances team productivity by focusing on impactful activities. Why waste time creating content formats that don't convert?
4. Prove Your Value
ROI metrics provide clear evidence of the value your content marketing brings to stakeholders.
You can present data showing how specific campaigns contributed to lead generation, customer acquisition, and revenue growth. According to CoSchedule's marketing strategy research, marketers who calculate ROI are 1.6X more likely to receive higher budgets.
This proof of success helps justify current and future investments in content marketing, ensuring continued support and funding. When you walk into a budget meeting with concrete ROI data, the conversation changes completely.
Content Marketing ROI Benchmarks for SaaS
Understanding industry benchmarks helps you evaluate whether your content marketing performance is competitive.
Average Content Marketing ROI by Industry
According to Content Marketing Institute's B2B benchmarks, B2B companies see average content marketing ROI ranging from 200% to 500%.
SaaS companies typically fall in the middle of this range. HubSpot's marketing data shows that companies publishing 16+ blog posts per month generate 3.5X more traffic and 4.5X more leads than those publishing 0-4 posts.
Here's what good looks like:
- Excellent ROI: 400%+ (you're generating $4+ for every $1 spent)
- Good ROI: 200-400% (solid performance, room for optimization)
- Average ROI: 100-200% (breaking even to modest returns)
- Poor ROI: Below 100% (losing money on content)
ROI by Content Type
Different content types deliver different returns. Based on industry data from Semrush's content marketing report:
Highest ROI Content Types:
- Case studies and customer success stories (350-450% average ROI)
- Video content (300-400% average ROI)
- Original research and data studies (280-380% average ROI)
- In-depth guides and ebooks (250-350% average ROI)
Medium ROI Content Types:
- Blog posts and articles (150-250% average ROI)
- Webinars and online events (180-280% average ROI)
- Infographics and visual content (140-220% average ROI)
Variable ROI Content Types:
- Social media posts (50-300% ROI depending on platform)
- Email newsletters (100-400% ROI depending on list quality)
- Podcasts (highly variable, 100-500% ROI)
ROI by Channel
LinkedIn's B2B marketing benchmarks show significant variation in ROI across distribution channels:
- Organic search: 200-400% ROI (highest long-term returns)
- Email marketing: 180-350% ROI (strong for nurturing)
- LinkedIn: 150-300% ROI (best for B2B SaaS)
- YouTube: 140-280% ROI (growing steadily)
- Twitter/X: 80-180% ROI (lower but good for awareness)
Your actual results will vary based on your specific audience, content quality, and execution. The key is tracking your performance against these benchmarks to identify improvement opportunities.
How to Calculate Content Marketing ROI for your SaaS business?
Calculating content marketing ROI for your SaaS business involves several key steps. Let's break down each one with specific examples.
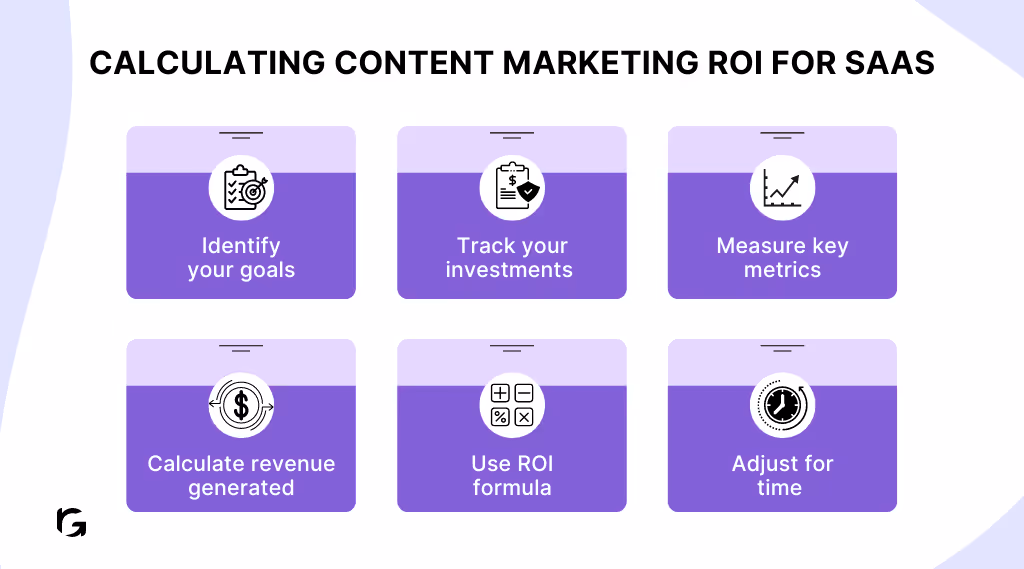
- Identify your goals
- Track your investments
- Measure key metrics
- Calculate revenue generated
- Use ROI formula
- Adjust for time
Step 1: Identify Your Goals
Determine what you aim to achieve with your content marketing efforts.
Common goals include:
- Increasing brand awareness
- Generating qualified leads
- Driving product signups or demos
- Reducing customer acquisition cost
- Improving customer retention
Be specific. Instead of "generate more leads," aim for "generate 500 marketing qualified leads per quarter with a 15% conversion rate to opportunities."
Step 2: Track Your Investments
Document all expenses related to content creation and distribution.
Content Creation Costs:
- Writer and editor salaries or freelance fees
- Designer and videographer costs
- Content management tools (like these platforms)
- Stock photos, graphics, or video assets
- Subject matter expert time
Distribution Costs:
- SEO tools and software
- Email marketing platforms
- Social media advertising
- Content promotion and syndication
- Analytics and tracking tools
Let's say your monthly content costs are:
- 2 full-time content creators: $12,000
- Freelance designers: $2,000
- Tools and software: $1,500
- Paid promotion: $3,500
- Total monthly investment: $19,000
Step 3: Measure Key Metrics
Track metrics that align with your goals using tools like Google Analytics 4, your CRM, and marketing automation platforms.
For Lead Generation Goals, track:
- Number of leads generated from content
- Lead quality scores
- Conversion rate from lead to opportunity
- Cost per lead
- Lead velocity
For Revenue Goals, track:
- Revenue attributed to content touchpoints
- Average deal size influenced by content
- Sales cycle length
- Customer acquisition cost
- Customer lifetime value
According to Salesforce's marketing research, 72% of high-performing marketing teams use data-driven strategies to measure content impact.
Step 4: Calculate Revenue Generated
Attribute revenue to your content marketing efforts by tracking sales and conversions that resulted from your content.
Use multi-touch attribution to understand content's role across the buyer's journey. Many sales involve 5-7 touchpoints, and content often plays a role in multiple stages.
Example attribution:
- First-touch: Blog post discovered via search
- Mid-funnel: Downloaded comparison guide
- Late-stage: Attended webinar
- Final touch: Reviewed the case study before purchase
If that sale was worth $50,000 and content influenced 4 of 5 touchpoints, you could attribute $40,000 (80%) to content marketing.
Step 5: Use the ROI Formula
Apply the formula: ROI = [(Revenue from Content - Cost of Content) / Cost of Content] × 100
Using our example:
- Monthly content investment: $19,000
- Revenue attributed to content: $95,000
- ROI = [($95,000 - $19,000) / $19,000] × 100
- ROI = 400%
This means for every dollar spent on content, you're generating $4 in return.
Step 6: Adjust for Time
For SaaS businesses with recurring revenue models, calculate ROI over different time periods.
Short-term ROI (0-3 months): Often negative or low as content takes time to gain traction
Medium-term ROI (6-12 months): Content starts ranking, building audience, generating leads
Long-term ROI (12+ months): Compounding returns as the content library grows and evergreen content continues driving results
According to Ahrefs' research on content longevity, well-optimized content can continue generating traffic and leads for 2-3 years or more. This long tail effect significantly impacts true ROI.
Common ROI Calculation Mistakes
Avoid these common pitfalls that lead to inaccurate ROI measurements.
Mistake 1: Ignoring Assisted Conversions
Many marketers only credit the last touchpoint before conversion, ignoring content that assisted earlier in the journey.
The Fix: Use multi-touch attribution models that credit all touchpoints. According to Google Analytics attribution research, assisted conversions often represent 40-60% of total conversions.
Mistake 2: Not Accounting for Long Sales Cycles
B2B SaaS sales cycles average 3-9 months. Content published today might not generate revenue until next quarter.
The Fix: Track cohorts over time. Measure the ROI of content published in Q1 by looking at deals closed in Q2-Q4 that involved that content.
Mistake 3: Forgetting Overhead Costs
Many marketers only track direct content costs, missing overhead expenses.
The Fix: Include all costs such as management time, meetings, strategy sessions, tool licenses, training, and administrative overhead.
Mistake 4: Measuring Too Soon
Content needs time to rank, build authority, and generate compounding returns.
The Fix: Measure performance at 30, 90, 180, and 365 days. Track how ROI improves over time as content gains traction.
Mistake 5: Not Tracking Brand Metrics
Content often builds brand awareness that indirectly influences purchases.
The Fix: Track branded search volume, direct traffic growth, social mentions, and brand sentiment alongside direct conversion metrics.
Introducing Our Content ROI Dashboard
Our Content ROI Dashboard is designed to help marketers understand and improve their content performance without the complexity of enterprise analytics platforms.
What Makes Our Dashboard Special
Easy to Use
Our dashboard is simple and user-friendly. You don't need technical skills or data science knowledge to use it. The interface is intuitive, and setup takes minutes, not days.
Real-Time Data
Get the latest performance data for your content and make timely adjustments to your strategy. Unlike monthly reports that are outdated by the time you see them, our dashboard updates continuously.
Detailed Reports
Access in-depth reports that analyze your content's impact, including:
- Engagement metrics across all channels
- Conversion rates by content type
- ROI calculations with visual breakdowns
- Attribution modeling showing content influence
- Trend analysis and performance predictions
Customizable Metrics
Adjust the dashboard to track the metrics that matter most to your business. Whether you focus on demand generation metrics, lead quality, or revenue attribution, you can configure views that align with your goals.
How It Compares to Other Solutions
Unlike enterprise platforms that cost $500+ per month and require consultants to set up, our dashboard is free and ready to use immediately. Unlike basic spreadsheets that require manual data entry and calculations, our dashboard pulls data automatically and updates in real time.
Real ROI Calculation Examples
Let's walk through three real-world examples showing how different content types generate ROI.
Example 1: Blog Content ROI
Scenario: SaaS company publishes 12 blog posts per month
Investment:
- Writer costs: $4,000/month
- Editor costs: $1,500/month
- Design and formatting: $500/month
- SEO tools: $200/month
- Total monthly cost: $6,200
Results after 6 months:
- 45,000 monthly organic visitors
- 1,350 leads generated (3% conversion rate)
- 135 opportunities created (10% lead-to-opportunity rate)
- 14 customers acquired (10% close rate)
- Average deal size: $5,000
- Total revenue: $70,000
ROI Calculation:
- 6-month investment: $37,200
- Revenue generated: $70,000
- ROI = [($70,000 - $37,200) / $37,200] × 100 = 88% ROI
After 12 months as content compounds, ROI typically increases to 200-300%.
Example 2: Video Content ROI
Scenario: SaaS company creates 4 educational videos per month
Investment:
- Videographer: $3,000/month
- Equipment and software: $500/month
- Promotion and distribution: $1,500/month
- Total monthly cost: $5,000
Results after 3 months:
- 120,000 video views
- 3,600 website visits from video CTAs (3% click rate)
- 180 leads generated (5% conversion rate)
- 27 opportunities created (15% lead-to-opportunity rate)
- 5 customers acquired (18% close rate)
- Average deal size: $8,000
- Total revenue: $40,000
ROI Calculation:
- 3-month investment: $15,000
- Revenue generated: $40,000
- ROI = [($40,000 - $15,000) / $15,000] × 100 = 167% ROI
Video content often delivers higher engagement and conversion rates than text content.
Example 3: Webinar ROI
Scenario: SaaS company hosts 2 webinars per month
Investment:
- Speaker preparation time: $1,000/month
- Webinar platform: $200/month
- Promotion costs: $2,000/month
- Follow-up nurturing: $800/month
- Total monthly cost: $4,000
Results per webinar:
- 250 registrants
- 100 attendees (40% show rate)
- 35 hot leads (35% lead rate)
- 12 opportunities created (34% lead-to-opportunity rate)
- 3 customers acquired (25% close rate)
- Average deal size: $12,000
- Revenue per webinar: $36,000
- Monthly revenue (2 webinars): $72,000
ROI Calculation:
- Monthly investment: $4,000
- Revenue generated: $72,000
- ROI = [($72,000 - $4,000) / $4,000] × 100 = 1,700% ROI
Webinars often deliver exceptional ROI because they attract high-intent prospects and enable direct engagement.
Benefits of Using Our Content ROI Dashboard
Implementing and using our content ROI dashboard offers several game-changing advantages.
Find High-Performing Content
Discover which content drives the most engagement, traffic, and sales. Use this information to create more successful content.
You'll get a clear picture of what resonates with your audience, allowing you to replicate and scale winning strategies. It's all about focusing on what works and doubling down on it.
Improve Your Strategy
Use the insights from the dashboard to continually refine and optimize your content marketing strategy.
Understand which channels and formats work best and allocate resources accordingly. This way, you're always in the know about what's effective, making tweaks that keep your content fresh and impactful.
Increase Efficiency
Spend less time guessing and more time on actions that deliver results.
The dashboard helps you focus on activities that give the highest returns. It streamlines your efforts, so you're not wasting time on low-impact tasks. This means you can achieve more with less, boosting productivity across your team.
Showcase Success
With clear ROI metrics, you can show the success of your content marketing efforts to stakeholders.
This transparency helps in making informed decisions and justifying your marketing spend. It also positions you as a strategic leader who delivers measurable results, making it easier to get buy-in for your ideas and secure budget increases.
Advanced Tips to Optimize Your Content ROI
Want to squeeze even more value from your content? Here are proven strategies that top performers use.
Choose the Best Channels
Look at which platforms give you the best results and prioritize them for sharing your content.
Move resources away from channels that aren't performing well. According to LinkedIn's marketing benchmarks, B2B companies typically see the best ROI from LinkedIn, email, and organic search.
Update Old Content
Regularly review older content that still gets traffic. Add fresh insights, statistics, and visuals to boost its performance.
According to HubSpot's content optimization research, updating and republishing old posts can increase organic traffic by 106% on average.
Predict Trends
Use the dashboard to forecast which topics will be popular in the future. Plan your content around these predictions to stay ahead of the curve.
Look for search volume trends, competitor content gaps, and emerging keywords in your content marketing channels and strategy.
Match Content to Sales Stages
Create content for different stages of the buyer's journey.
Use the dashboard to see which types of content work best at each stage. Top-of-funnel content (blogs, videos) builds awareness. Middle-funnel content (guides, comparisons) aids evaluation. Bottom-funnel content (case studies, demos) closes deals.
Repurpose Content
Turn high-performing content into different formats like videos, infographics, or podcasts.
This helps you reach a wider audience and maximize ROI from content you've already created. One comprehensive guide can become 10+ social posts, 3 videos, an infographic, and a webinar presentation.
Monitor Competitors
Use the dashboard to see how your competitors are performing.
Find gaps in their content distribution strategy and use them to your advantage. If competitors aren't creating video content or leveraging certain channels, those represent opportunities.
How to Get Started
Taking control of your content marketing ROI is simple with our Content ROI Dashboard. Here's how you can get started today.
Step 1: Download the Dashboard
Visit our website to download the Content ROI Dashboard. It's quick and easy to get started. No credit card required, no lengthy forms.
Step 2: Integrate Your Data
Connect the dashboard to your existing content marketing platforms and data sources.
Our user-friendly setup process ensures seamless integration with Google Analytics, your CRM, marketing automation platforms, and social media accounts. Most integrations take less than 10 minutes.
Step 3: Analyze and Act
Begin tracking your content performance in real time.
Use the insights provided to make informed decisions and optimize your strategy for better results. The dashboard includes pre-built reports and recommendations to get you started quickly.
Step 4: Optimize and Scale
As you gather data, identify your highest-performing content and channels.
Double down on what works, eliminate what doesn't, and continuously refine your approach. The dashboard's trend analysis helps you spot opportunities before competitors do.
Download the Content ROI Dashboard Now
Ready to transform your content marketing? Try our Content ROI Dashboard to improve your content marketing efforts.
Get powerful analytics, detailed reports, and actionable insights to reach your goals faster. Join hundreds of SaaS companies already using our dashboard to prove content marketing ROI and secure bigger budgets.
Download the Free Dashboard and start tracking your content ROI today.
Need help getting started? Contact our team for personalized guidance on maximizing your content marketing ROI.
.svg)
.webp)